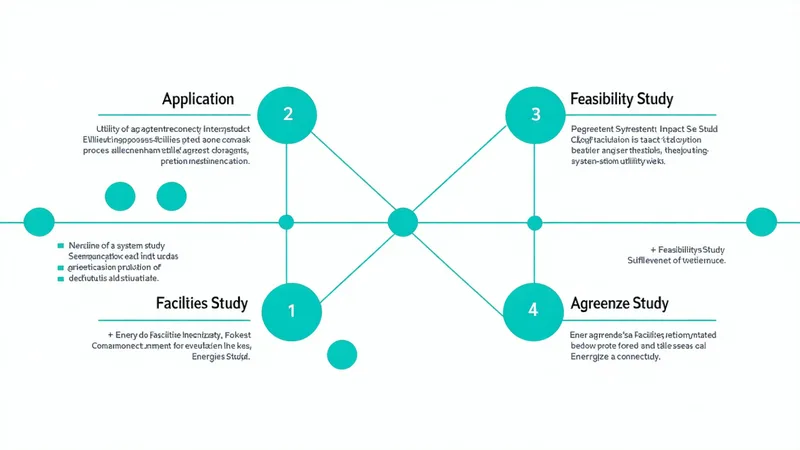
The utility interconnect process is the single largest source of project delay in solar development. LBNL's annual Queued Up report has tracked median queue wait times increasing from roughly 2 years in 2015 to over 4 years for projects entering the queue in 2022 in high-demand ISO territories. Distribution-level DER interconnect — the queue that governs rooftop solar, commercial storage, and small-scale generation — is governed by separate state-level tariffs and in most territories is less studied and less visible than the transmission queue, but no less slow.
For software developers building DER project management tools, understanding this process is not just background context. Each stage of the interconnect process has data associated with it — study timelines, engineering requirements, cost estimates, milestone dates — and knowing which data is queryable at each stage determines what your application can surface to users and when.
Phase 1: Pre-Application and Screening
Before filing a formal interconnection application, project developers typically conduct pre-application screening to assess whether a candidate site is feasible. The utility may offer a formal pre-application report (PAR) process, or the developer may rely on publicly available capacity data.
At this stage, the data your application can query includes:
- Distribution feeder capacity — the available hosting capacity on the feeder serving the site, published by utilities under FERC Order 2222 hosting capacity requirements and state-level equivalents. Accuracy varies; California's Rule 21 Integrated Capacity Analysis (ICA) maps are among the most detailed publicly available.
- Queue depth at the point of interconnection — how many MW of active projects are already ahead in the queue at the relevant substation or feeder segment
- Technology-specific constraints — whether the feeder has existing protection settings that limit export, or whether it's a radial circuit that can't accommodate bi-directional power flow without upgrades
Derapi's /v1/ders/interconnect/capacity endpoint returns feeder capacity data for this phase. The data is normalized from utility ICA maps, FERC-required hosting capacity filings, and queue depth calculations. For California utilities operating under Rule 21, ICA data is the primary source. For other states, Derapi uses a combination of utility filings and capacity estimation based on queue depth.
Phase 2: Interconnection Application
The formal application initiates the queue clock. The applicant submits required technical data — site address, proposed capacity (AC and DC), technology type, interconnection voltage, proposed meter configuration — along with an application fee that typically ranges from a few hundred dollars for residential DER to several thousand for commercial systems.
The application package requirements vary by utility. A residential solar application in California under Rule 21 requires a standard application form, a single-line diagram, and evidence of electrical contractor licensing. A commercial solar-plus-storage application in a PJM territory may require a more detailed technical package, including protection coordination studies and a proposed meter upgrade plan.
At this stage, Derapi's /v1/permits/ahj and /v1/utility/interconnect-requirements endpoints return the utility-specific application checklist. The interconnect-requirements endpoint is distinct from the AHJ permit endpoint: it covers the utility's interconnection study process, not the local building permit. Both are required; they run in parallel, not sequentially, and your application should model them as separate workstreams.
Phase 3: Feasibility Study
Not all utilities conduct a formal feasibility study for small DER systems. Under many state tariffs, systems below a threshold size (often 25 kW or 100 kW) are eligible for simplified interconnection review — sometimes called "fast-track" or "expedited" review — that skips detailed engineering studies if the system passes a set of automated screening criteria.
The fast-track screens check things like: does the project represent more than 15% of the feeder's peak load? Does it exceed the feeder's available hosting capacity from the ICA? Are there protection coordination conflicts with existing equipment? If all screens pass, the application moves directly to an interconnection agreement without a full system impact study.
If any screen fails, the project enters the detailed study track. This is where timelines expand significantly. A system impact study (SIS) typically takes 4–6 months at well-resourced utilities and 6–18 months at utilities with understaffed interconnect departments — a wide range that reflects the staffing reality across the US utility industry.
Derapi's study_track field in the interconnect response indicates which track the project has been assigned to where that data is available. For projects entering the queue in real time, the field reflects the utility's published assignment based on the screening results.
Phase 4: System Impact Study (SIS)
The system impact study is the engineering core of the interconnect process. The utility's engineers analyze whether connecting the proposed DER at the proposed POI creates power quality, reliability, or protection coordination problems on the distribution or transmission system. The SIS output is a report that identifies any required upgrades and estimates their cost — upgrades that the project developer is typically required to fund.
The SIS upgrade cost estimate is one of the most consequential pieces of data in a project's economics. A $50,000 transformer upgrade is manageable for a 500 kW commercial system. A $500,000 substation upgrade can kill the same project's economics entirely. Many projects are withdrawn from the queue after receiving their SIS cost estimate — which is why queue withdrawal rates are high in congested territories and why capacity data can become stale quickly as withdrawn MW free up headroom.
For an engineering team building a project development tool in 2024, consider the scenario of a cleantech developer evaluating 20 candidate sites in a Pacific Northwest utility territory where the queue had grown substantially since 2021. The SIS cost estimates for five of those sites, returned via the utility's interconnect portal 8 months after application, showed upgrade costs that made the projects unfinanceable at projected solar module prices. The team had no way to predict this before application — the feeder hosting capacity data had suggested adequate headroom, but the SIS found protection coordination issues that the ICA maps didn't reflect. This is a known limitation of pre-application capacity data: it's a necessary but not sufficient indicator of interconnect cost.
Phase 5: Facilities Study and Interconnection Agreement
If the project proceeds past the SIS, the facilities study details the exact scope, cost, and timeline of any required utility infrastructure upgrades. The facilities study is typically shorter than the SIS — 1–3 months — but it can surface new scope issues if the SIS estimates were preliminary.
Once the facilities study is complete, the utility and project developer negotiate and execute an interconnection agreement (IA). The IA is the legal contract governing the terms of the grid connection: the approved capacity, the export conditions, the metering configuration, and the utility's performance obligations. Execution of the IA is the milestone that allows construction to begin.
Derapi's queue endpoint tracks IA execution as a status milestone. A queue entry with status: "ia_executed" and an ia_date field is a project that has cleared the major regulatory hurdle. Projects in the queue with this status are predictable for a project management tool — they're in construction or pre-construction phase, not waiting on regulatory milestones.
Where the Queue Data Breaks Down
We're not saying that programmatic access to queue data solves all the visibility problems in the interconnect process. Several gaps remain, and your application should design around them rather than implicitly assuming complete data.
Study cost estimates are typically not in the publicly published queue data. The SIS report with its upgrade cost is a document sent to the applicant, not a structured data field published to the queue. Derapi does not have access to project-level SIS cost estimates; that data requires direct utility engagement or applicant disclosure.
Timeline estimates are probabilistic, not deterministic. The study_completion_estimate field in Derapi's queue response is derived from the utility's published target timelines and current workload — it's a plausible range, not a utility commitment. Some utilities are on schedule with their published study timelines; many are not. Building a project management tool that shows "estimated IA execution: Q3 2026" is useful for planning, but the UX must communicate the uncertainty range.
Queue position is necessary but not sufficient for timeline prediction. A project at queue position 15 at a substation with 14 active projects ahead is not necessarily 14 SIS cycles away — some projects ahead may be in final agreement stages, some may be withdrawn, and the utility may process multiple projects in parallel. The queue is a useful approximation of relative timing; it's not a scheduling calendar.
Building a Project Tracker With Queue Data
The highest-value application pattern for interconnect queue data is a project status tracker that monitors a portfolio of projects through their study milestones and alerts the team to status changes. The workflow is straightforward: at application, store the queue_id for each project. Poll /v1/ders/interconnect/queue/{queue_id} daily. When last_status_change is more recent than your last poll, trigger a notification.
The notification can drive downstream actions: a status change to sis_complete means a cost estimate is available and the financial model should be updated; a status change to ia_executed triggers the construction permitting workstream; a status change to withdrawn prompts a review of whether the project should be re-queued at a different POI.
Pair the queue tracker with Derapi's capacity endpoint, re-run after each withdrawal in the territory, and your application gives project developers a real-time view of queue dynamics in their target markets — which sites are opening up, which territories are getting more or less congested, and where to focus site acquisition resources. That's the data workflow that replaces quarterly consultant reports with a background job.